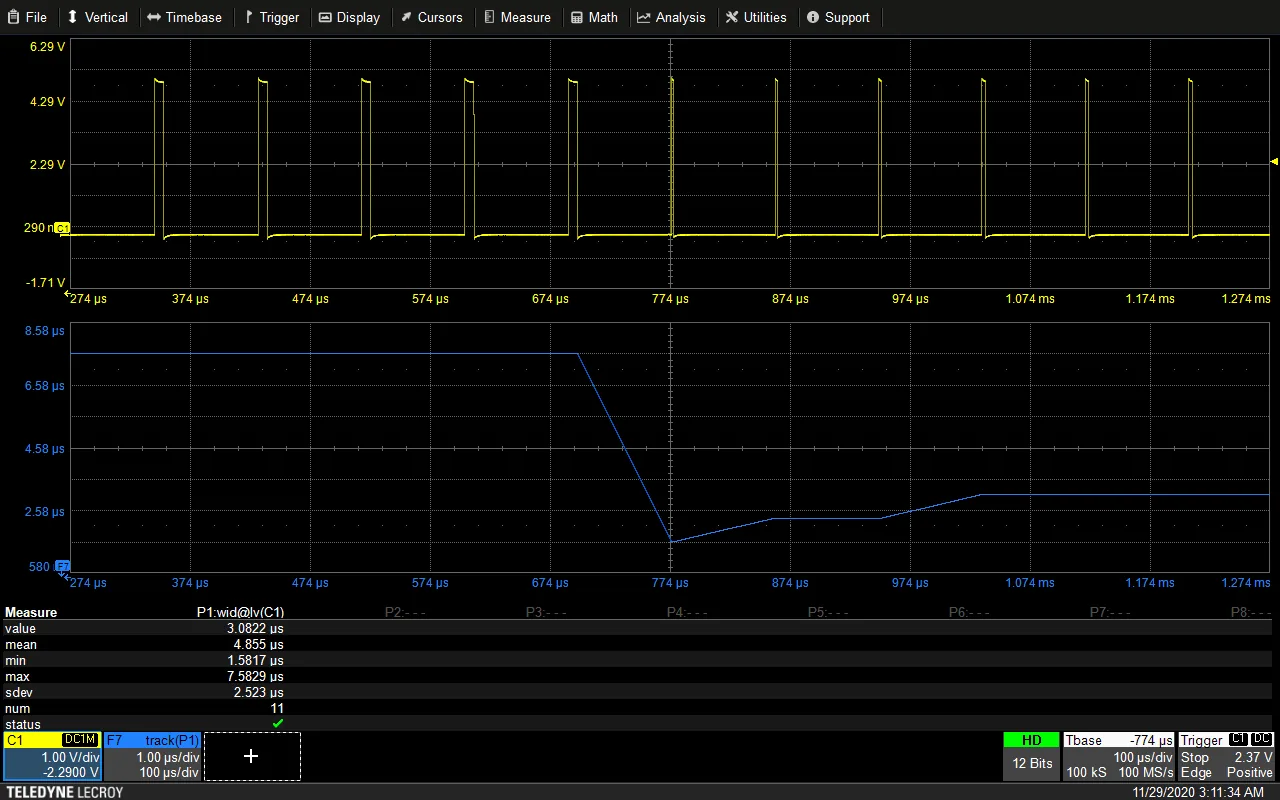
Why it matters: Trend and track look similar on screen—both plot a measured parameter as a line graph—but they answer fundamentally different questions. Using the wrong one means either missing a slow drift that spans hours, or losing the fine timing detail within a single acquisition. Knowing which to reach for is the difference between a graph that shows what you need and one that quietly hides it.
What Makes a Track Different
A track plots a measured parameter—pulse width, period, rise time, or similar—against time, synchronized to the input waveform within a single acquisition. Every point on a track corresponds to a specific moment in that one capture, so a track preserves timing correlation: you can line up a spike in the track with the exact waveform event that caused it. Once a new acquisition starts, the track is overwritten and starts fresh.
What Makes a Trend Different
A trend also plots a measured parameter as a line, but it is not time-synchronized to the input waveform. Instead, a trend retains one value per measurement event and plots them in sequential order across multiple acquisitions. It has no fixed relationship to elapsed time within a single capture—its horizontal axis is simply "measurement number." Crucially, a trend accumulates: unlike a track, it retains the history of every value measured across previous acquisitions, not just the most recent one.
Use Trends to Observe Long-Term Change
Trends are the right tool whenever the behaviour of interest unfolds over a timescale much longer than a single acquisition—thermal drift during a chamber test, gradual component aging, or slow supply voltage sag over the course of an extended test run. A track, bound to one acquisition window, cannot show this: it would need an acquisition long enough to span the entire test, which is often impractical. A trend, accumulating one value per acquisition over the full test duration, makes gradual variation directly visible as a rising, falling, or wandering line.
Use Trends as a Data Logger for Sparse Events
Trends are equally valuable when the event under test is infrequent—a single pulse per acquisition, an occasional glitch, or a rare trigger condition. Each new acquisition contributes one more point to the trend, so after many acquisitions the trend has effectively built a logged history of a measurement that would otherwise be scattered across dozens of individual, disconnected captures. This turns a sparse, hard-to-correlate event into a single continuous dataset that can be reviewed, statistically analysed, or exported as a whole.
Parameters Commonly Plotted as Trends
- Pulse width and period, for monitoring clock or signal stability over an extended run
- Rise time and fall time, for tracking edge-rate degradation over a test cycle
- Duty cycle, for PWM and switching-regulator stability monitoring
- Skew, for multi-channel timing relationships that need to be watched over time
- Slew rate, setup time, and hold time, for margin monitoring in digital interfaces
- Custom or scripted measurement values, for application-specific parameters not covered by a built-in measurement
Choosing Between Track and Trend
The decision comes down to one question: does the timing relationship within a single acquisition matter, or does the history across many acquisitions matter? If you need to know exactly when, within one capture, a parameter changed—use a track. If you need to know how a parameter is evolving across an entire test session, a thermal sweep, or a series of sparse trigger events—use a trend. The two are complementary rather than competing tools, and many debug sessions end up using both: a track to understand what happens inside one acquisition, and a trend to understand how that behaviour changes over the full test.
Primeasure Field Tip
On long thermal or burn-in test runs, we set up a trend on the parameter most sensitive to the failure mode under investigation before the test starts, not after something goes wrong. A trend can only show history it was running to capture—starting it late means losing exactly the drift you were trying to characterise.
Primeasure POV
- Default to a track for single-acquisition timing debug, and switch to a trend the moment your question spans more than one acquisition or one trigger event.
- For thermal chamber and long-duration reliability testing, start the trend before the test begins—it only accumulates data going forward.
- For sparse or rare-event debugging, a trend converts scattered single-shot captures into one analysable dataset, avoiding manual correlation across dozens of screenshots.
- Teledyne LeCroy oscilloscopes support both track and trend natively across the full parameter set, including custom and scripted measurements, without needing external logging software.
Setting Up a Long-Duration or Sparse-Event Test?
Primeasure supports engineering teams across India with Teledyne LeCroy oscilloscopes and the measurement configuration expertise to make long-run and low-frequency-event testing straightforward.
Explore Primeasure's Test & Measurement solutions available across India.
Talk to PrimeasureTopic informed by industry guidance on when to use trend versus track graphing for oscilloscope measurements.